The V-Dem dataset is one of the largest social science data collection projects on democracy, based at the University of Gothenburg. V-Dem provides 600+ indicators across all countries from 1789 to the present, measuring five high-level principles of democracy: electoral, liberal, participatory, deliberative, and egalitarian. Each principle is represented by an index and it is further broken down into components, each measured separately. Components (i.e. sub-indexes) include features such as free and fair elections, civil liberties, judicial independence and so on. Finally, each component is disaggregated into specific indicators (i.e. individual measurements or variables) For a quick overview of V-Dem data and methodology, click here.
2.1 Description
The dataset contains five key variable types based on their coding method:
Variable Types in the V-Dem Dataset
Type
Description
Examples
A / A*
Factual data coded by project managers or research assistants from existing sources.
% of population with suffrage
C
Expert-coded variables, assessed by typically 5 or more country specialists (scholars or residents with deep country knowledge; identities kept confidential).
Harassment of journalists (Are individual journalists harassed — i.e., threatened with libel, arrested, imprisoned, beaten, or killed — by governmental or powerful nongovernmental actors? Responses in a scale from 0 to 4)
D
Indices or components aggregated from Type A or C variables.
Electoral democracy index, political corruption index
E
Variables imported from external sources.
—
The variables take the form of nominal (classifications, text, dates), numerical, ordinal (e.g., Likert-style scales), or interval scales (indexes) (Methodology).
Further metadata information: (i) the codebook explains each variable meaning, collection and coding, frequency and scale. Survey questions and answer options are detailed fully alongside the aggregation methodology across country expert [(Codebook)]https://www.v-dem.net/documents/55/codebook.pdf; (ii) the structure of aggregation document, i.e. the taxonomy of indexes, sub-indexes and indicators with codes [(Structure of aggregation)]https://www.v-dem.net/documents/57/structureofaggregation.pdf.
In the context of this work, I will concentrate on both indicators and indexes, to refer to higher level concepts, such as democracy rankings.
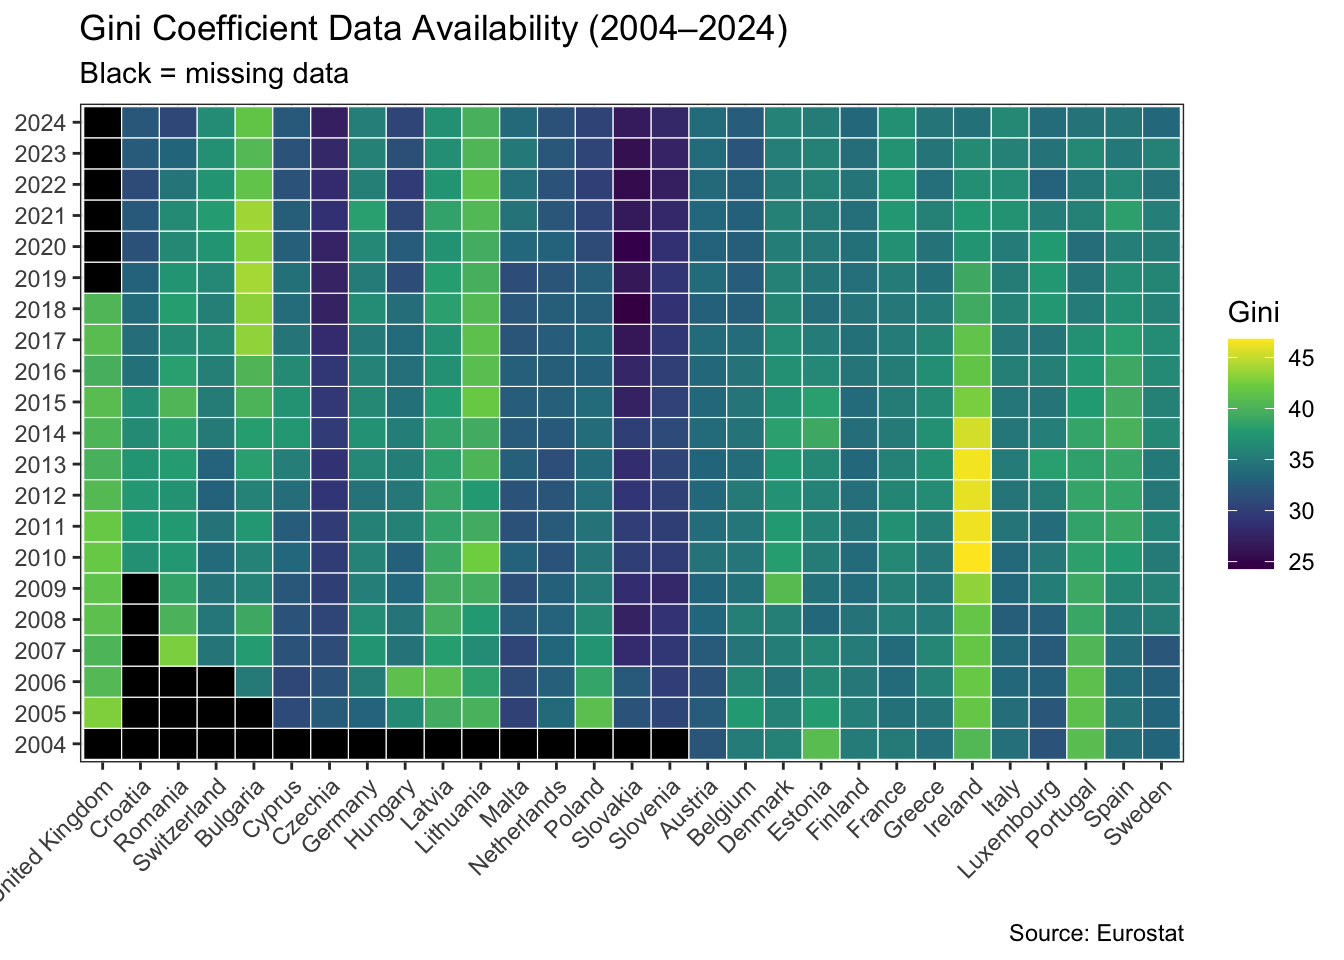
This analysis also makes use of macro-economic data from Eurostat, in particular the Gini coefficient for equivalised disposable income and real GDP per capita. Eurostat series presented some missing patterns, which I will adress in the following section.
Structure of the dataset
The V-Dem top five indices measure five high-level principles of democracy: electoral, liberal, participatory, deliberative, and egalitarian. Each index is an aggregation of sub-index components and each sub-index is an aggregation of variables. Most variables derive from an aggregation of expert judgments for features of democracy that are not directly observable (C type of variables, please refer to table above) .
The most central index in the dataset is the Electoral Democracy index: it measures to what extent “elections are free, fair, and reoccurring; elected officials wield political power de facto; suffrage is universal; political parties and candidates can form freely and compete; and the environment around elections make for a reasonably level playing field with speech, media, and civil society freedom.” (25 Years of Autocratization – Democracy Trumped?)
As highlighted in the methodology document: “we consider this measure fundamental to all other measures of democracy: we would not call a regime without elections “democratic” in any sense”.(Methodology)
Hence, in the remainder of this analysis the Electoral Democracy Index will be used as a proxy for democratic health and democratic backsliding, whilst the other indices will be used sparsely with the purpose of adding further dimensions and color to this central one.
V-Dem Dataset Structure: Indices, Sub-indices and Indicators. Click on the bubbles to see sub-components
Eurostat exhibits missing data patterns for the Gini coefficient series, as shown in the analysis below. This led me to drop the UK and adjust my time interval to 2010–2024 (instead of 2004–2024) for the part of this analysis that relates to income inequality.
Code
library(eurostat)library(tidyverse)country_list <-c("Austria","Belgium","Bulgaria","Croatia","Cyprus","Czechia","Denmark","Estonia","Finland", "France","Germany","Greece","Hungary","Italy", "Ireland", "Latvia", "Lithuania","Luxembourg","Malta","Netherlands", "Poland", "Portugal", "Romania","Slovenia", "Slovakia","Spain","Sweden","Switzerland", "United Kingdom")geo_codes_e <-get_eurostat_dic("geo")#Filter eurostat dictionary and get country codescountry_codes <- geo_codes_e |>filter(full_name %in% country_list) |>filter(nchar(code_name) ==2)|>pull(code_name)#Create Gini data dfgini_missing <-get_eurostat("ilc_di12c", time_format ="num", filters =list(geo = country_codes,time =2004:2025),stringsAsFactors =TRUE) |>arrange(geo, time) |>group_by(geo) |>#fill(values, .direction = "down") |> ungroup()#Add country names to Gini datagini_missing_names <- gini_missing |>left_join(geo_codes_e, by =c("geo"="code_name")) |>rename(country_name = full_name)gini_missing_names <- gini_missing_names |>mutate(missing =ifelse(is.na(values), 1, 0))ggplot(gini_missing_names, aes(x =fct_reorder(country_name, -missing, sum),y =factor(time), fill = values)) +geom_tile(color ="white") +scale_fill_viridis_c(na.value ="black") +theme_bw() +theme(axis.text.x =element_text(angle =45, hjust =1)) +labs(x =NULL, y =NULL, fill ="Gini",title ="Gini Coefficient Data Availability (2004–2024)",subtitle ="Black = missing data",caption ="Source: Eurostat" )